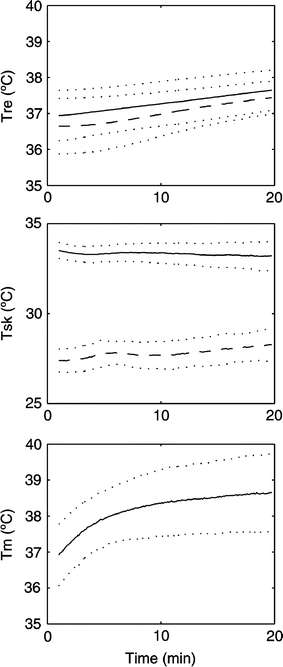
Fig. 2.

Top panel Rectal temperature (Tre) plotted over time at 60%  in the thermo-neutral (N) climate (dashed line) and in the hot dry (H) climate (solid line) ±SD (dotted lines). Center panel Skin temperature (Tsk) plotted over time at 60%
  in the thermo-neutral (N) climate (dashed line) and in the hot dry (H) climate (solid line) ±SD (dotted lines). Bottom panel Muscle temperature (Tm) plotted over time at 60%
  in the hot dry (H) climate (solid line) ±SD (dotted lines)
