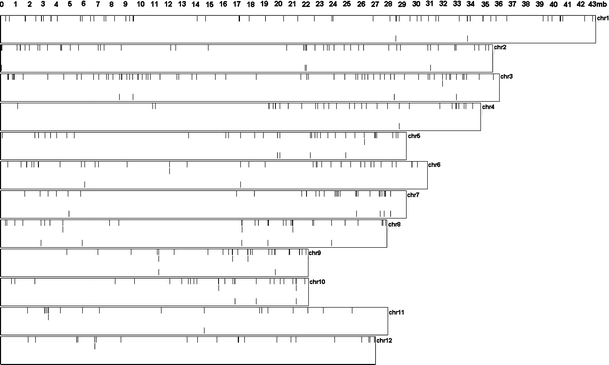
Fig. 1.

Distribution of local coexpression domains over all 12 rice chromosomes. Rectangles are schematic representation of chromosomes 1–12 from top to bottom. The numbers on the top show the scale in million bases along the chromosomes. Each gene in a local coexpression domain is depicted with a black bar. Only MPSS datasets excluding tandemly duplicated genes are shown. The orders of the drawings in each rectangle are: first lane, coexpressed pairs; second lane, coexpressed triplets; third lane, coexpressed quadruplets, fourth lane, partially syntenic coexpression domains (PSCDs) between Arabidopsis and rice
