
Fig. 1.
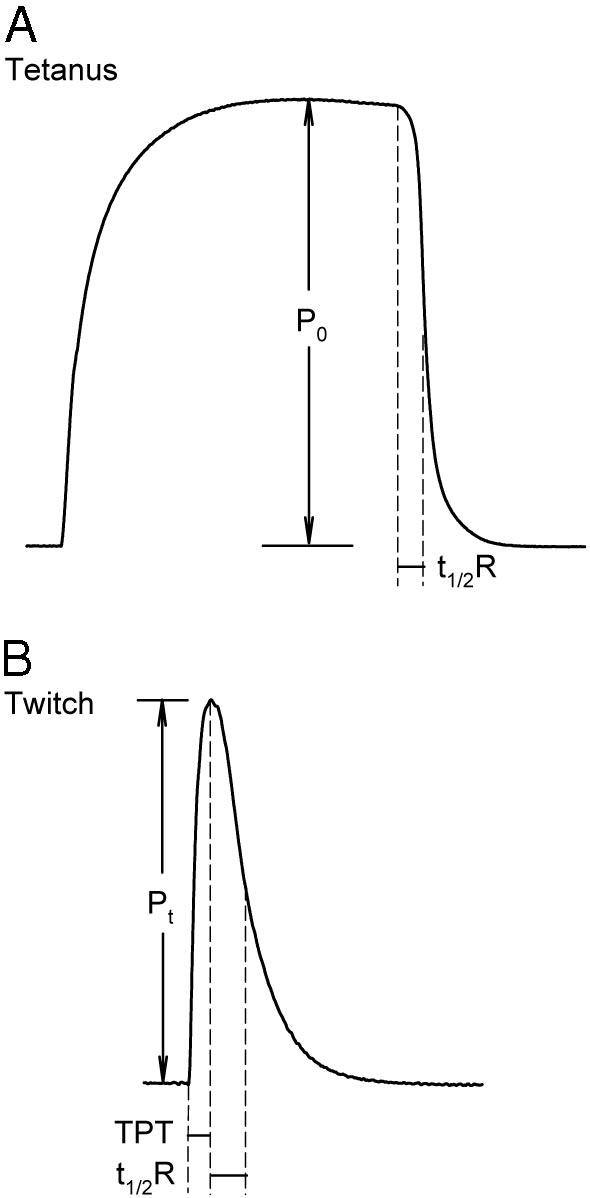
Representative twitch and tetanus measurements in rat soleus muscle. A, Maximal P0 was measured at the plateau of the tetanus. B, Maximal Pt, time to peak twitch tension (TPT), and t1/2R were measured at the L0 of the muscle.
Official websites use .gov
A
.gov website belongs to an official
government organization in the United States.
Secure .gov websites use HTTPS
A lock (
) or https:// means you've safely
connected to the .gov website. Share sensitive
information only on official, secure websites.
Representative twitch and tetanus measurements in rat soleus muscle. A, Maximal P0 was measured at the plateau of the tetanus. B, Maximal Pt, time to peak twitch tension (TPT), and t1/2R were measured at the L0 of the muscle.