Fig. 8.

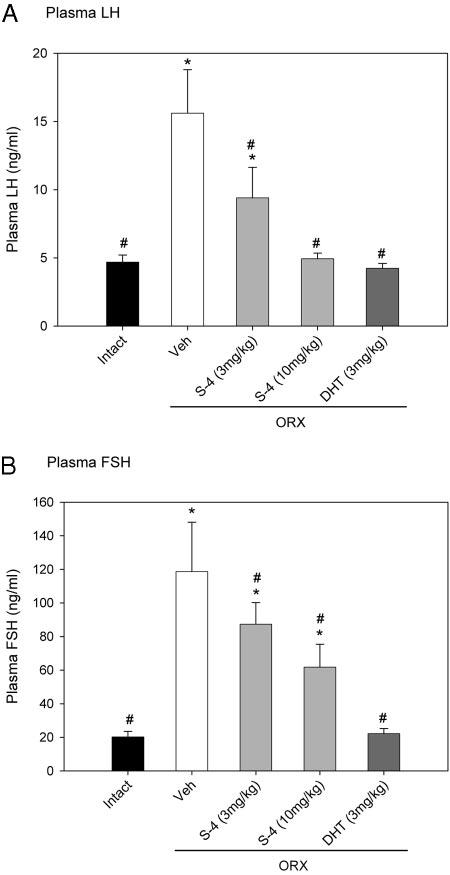
Plasma LH (A) and FSH (B) levels (n = 7–8) in different treatment groups. Data are presented as mean ± sd. *, P < 0.05, compared with the intact control group. #, P < 0.05, compared with the vehicle (Veh)-treated ORX group.

Plasma LH (A) and FSH (B) levels (n = 7–8) in different treatment groups. Data are presented as mean ± sd. *, P < 0.05, compared with the intact control group. #, P < 0.05, compared with the vehicle (Veh)-treated ORX group.