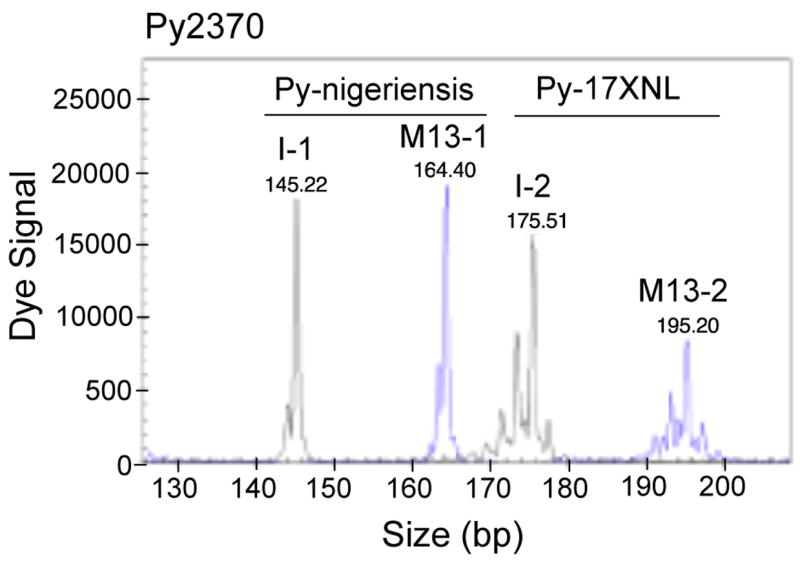
Fig. 3.

Comparison of dye signals from individually labeled primer and M13-tailed primer methods. PCR products of microsatellite Py2370 amplified using the two methods were mixed and loaded into the same capillary (0.2 μl PCR product for I-1, 0.6 μl for M13-1, 0.7 μl for I-2, and 1.6 μl for M13-2), and peaks of signals were printed directly from the DNA analyzer (Beckman CEQ8000). As expected, although signals from individually labeled primers were ~3 times stronger than those from M13-tailed/labeled primers, the signals from the M13-tailed primers were sufficient for allele calling. Weaker signals from the M13-tailed method can be compensated by loading a slightly larger amount of the PCR products. Peaks M13-1 and M13-2 were signals from M13-tailed primer method, and peaks I-1 and I-2 were from the individually labeled primer method. DNA samples were as labeled. Note that the patterns of the peaks were almost identical in both methods.
