
Figure 2.
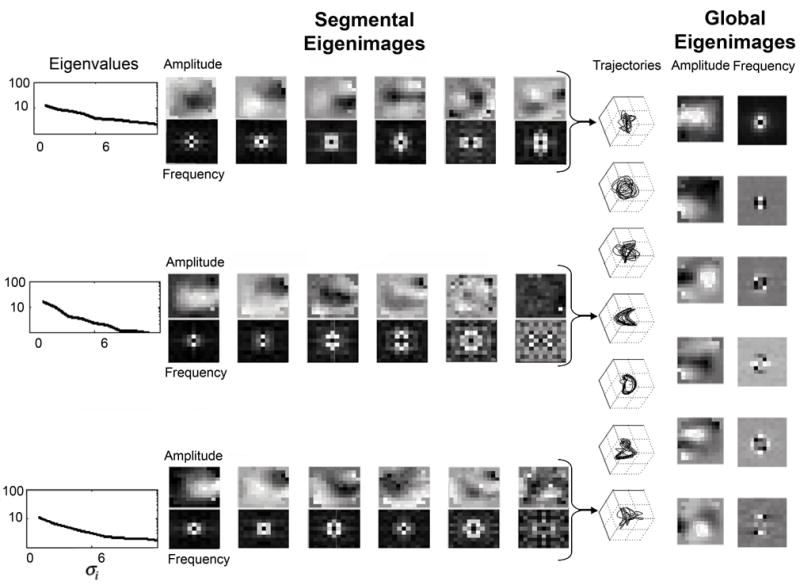
Dynamics from 7 sec oscillatory episode in Fig. 1. At the left side are shown the eigenvalues corresponding to the first 6 spatial eigenmodes vi based upon the photodetector amplitudes. Below the amplitude eigenmodes are shown the corresponding spatial frequency eigenmodes. These 3 sets of eigenmodes correspond to seconds 1, 4, and 7 from the episode. The column of trajectory plots from each of the 7 sec shows the relationship between the first three temporal modes ui. Note the simplification of dynamics during seconds 4–6. On the right are global amplitude and spatial frequency eigenmodes calculated from all 7000 images collected. Gray scale proportional to scaled eigenmode amplitudes.