
Fig. 3.
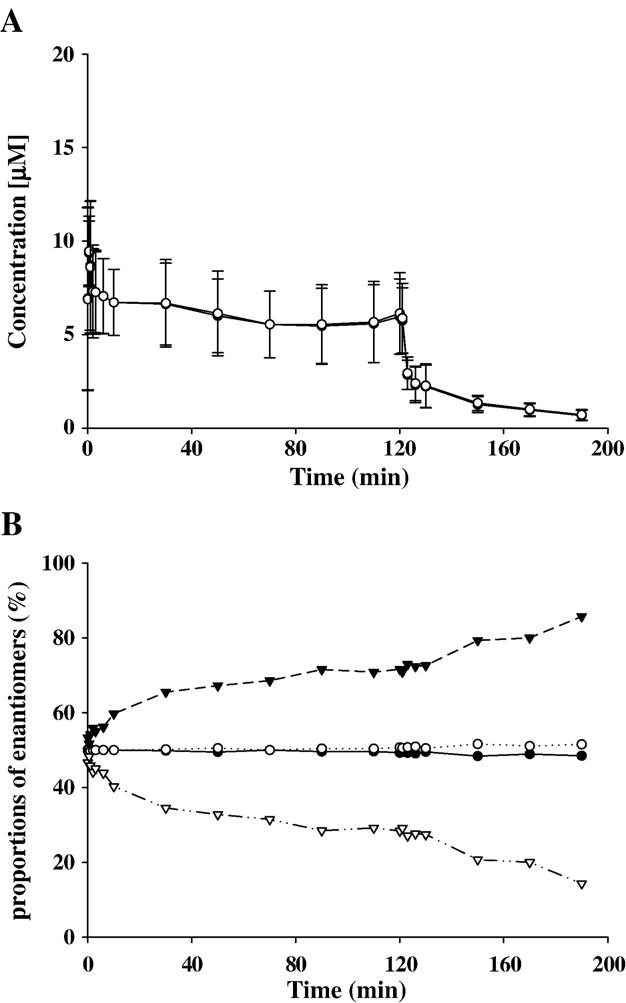
Plasma concentrations of R-ket and S-ket (not discernably different) in ponies (n=6) during and after TCI (presented as mean±SD) (A). Proportions of R-ket (open circles), S-ket (filled circles), R-nor (open triangle), and S-nor (filled triangle) in percent in plasma of ponies (n=6) during and after TCI (data are presented as mean) (B).