
Fig. 5.
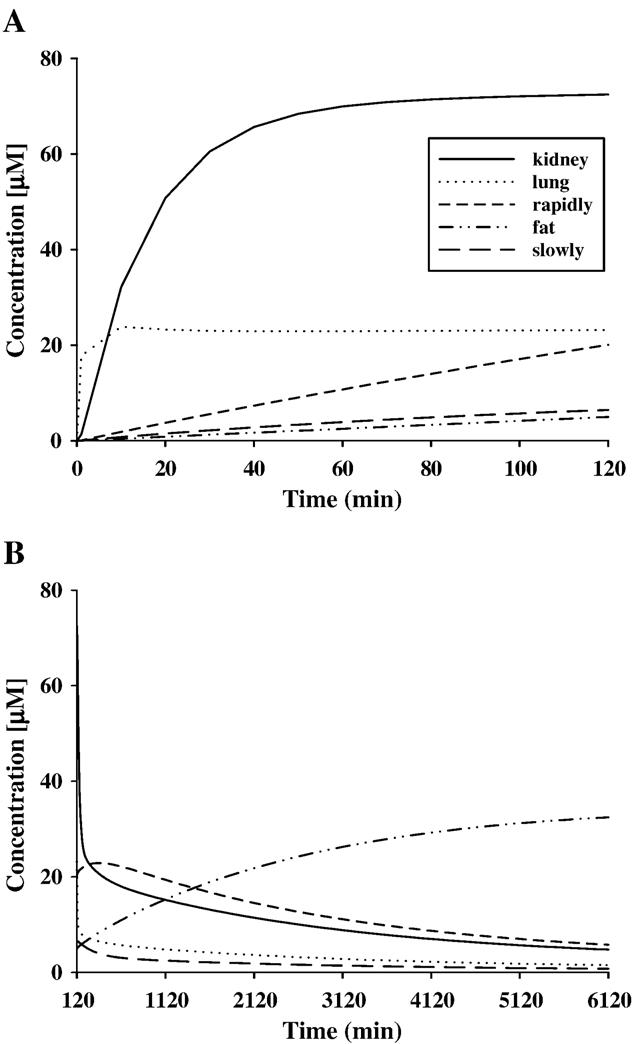
Predicted tissue concentrations of R-ket and S-ket for the pony whose plasma data are given in Fig. 4 during TCI (A) and after TCI (B). Equal values for tissue concentration of R-ket and S-ket are predicted for all time points.
Official websites use .gov
A
.gov website belongs to an official
government organization in the United States.
Secure .gov websites use HTTPS
A lock (
) or https:// means you've safely
connected to the .gov website. Share sensitive
information only on official, secure websites.
Predicted tissue concentrations of R-ket and S-ket for the pony whose plasma data are given in Fig. 4 during TCI (A) and after TCI (B). Equal values for tissue concentration of R-ket and S-ket are predicted for all time points.