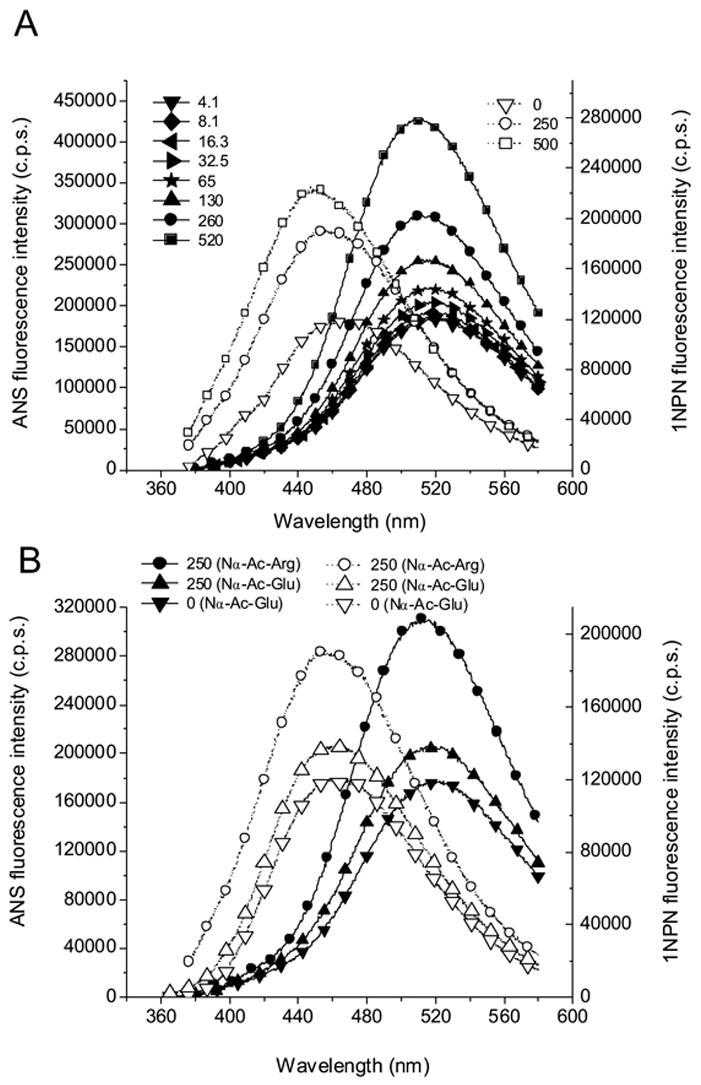
Figure 3.

The fluorescence spectra of ANS and 1NPN titrated with Nα-Ac-Arg and Nα-Ac-Glu at pH 7.3. The numbers following the solid and open symbols represent concentration (in mM) for Nα-Ac-Arg in (A) and for the amino acid derivative as indicated in (B). The fluorescence spectra of ANS and 1NPN for Nα-Ac-Arg are shown with Nα-Ac-Glu for comparison in (B). The solid lines and symbols denote 10 μM ANS and the dashed lines and open symbols denote 5 μM 1NPN.
