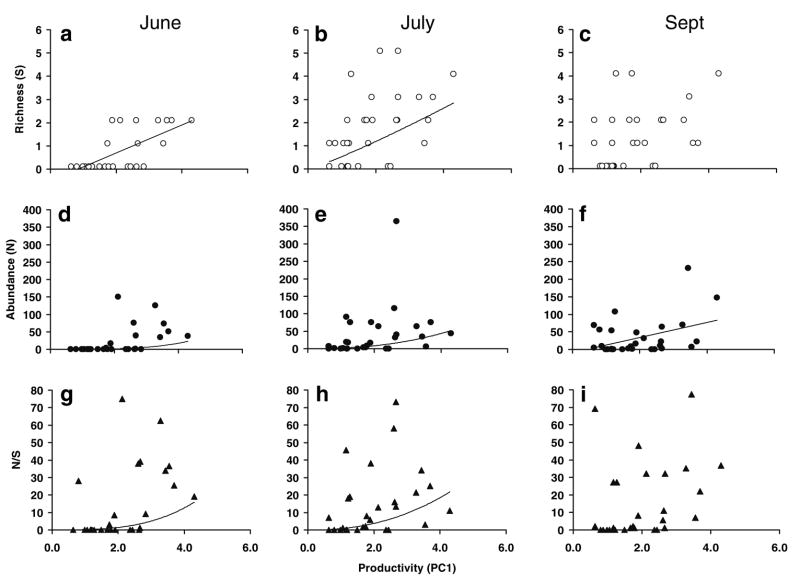
Fig. 3.
The relationship between productivity and species richness, total abundance, and abundance divided by richness (N/S) for artificial tree holes in June (a, d, g), July (b, e, h) and September (c, f, i) 2004. Productivity (PC1) is defined in Table 2. The x-axis has been shifted (PC1 + 2) to facilitate fitting the functions. Equations for regressions and the best-fit models are presented in Table 3

