
Figures 2A-2C. Hemispheric and horizontal renderings from MRI template of significant increases of K* for AA between 2.9 Hz and 0 Hz (dark condition), 7.8 Hz and 0 Hz, and 7.8 Hz and 2.9 Hz flash stimulation.
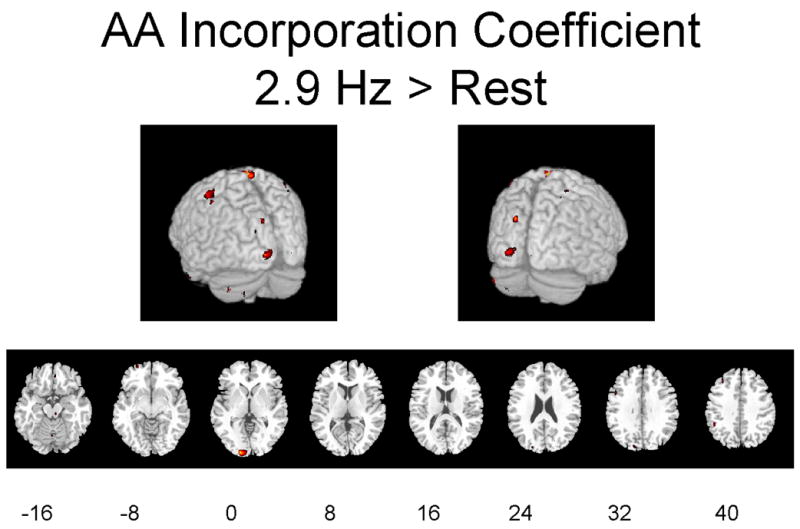
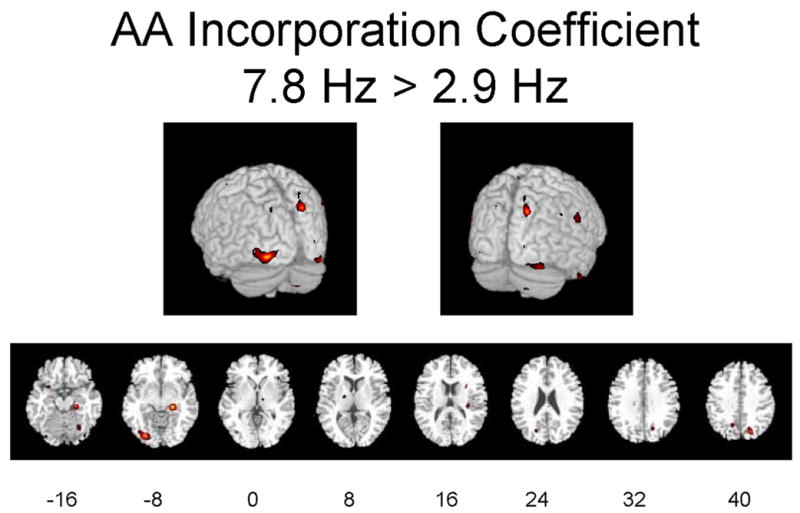
Significant differences at p ≤ 0.01 are displayed in red. Eight different slices are displayed from the −16 mm level to the +40 mm level in Talairach space are shown (Talairach and Tournoux 1988).