
Figure 2.
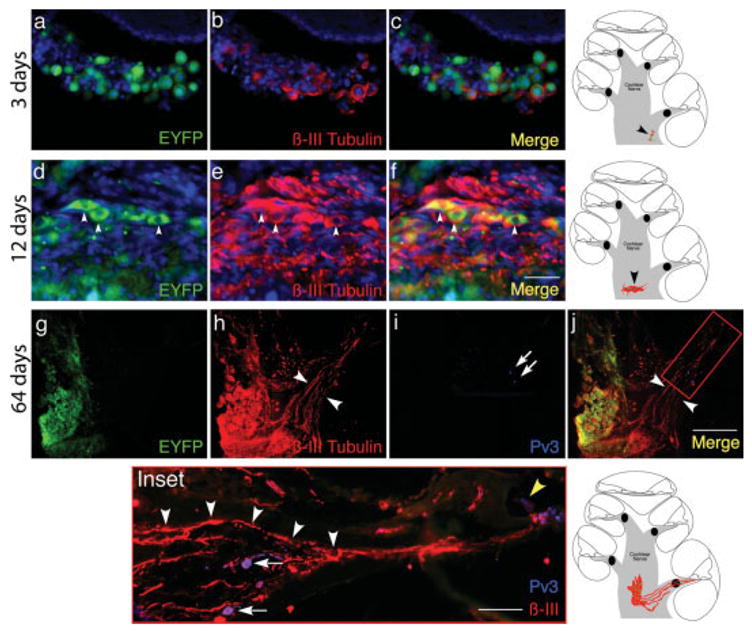
Grafted neural progenitors in the gerbil cochlea at 3, 12, and 64 days after transplantation. Neural progenitor cells were engrafted into a denervated ear 8 days after ouabain treatment. In a–c the ear is shown 3 days after transplantation. The grafted cells, identified by endogenous fluorescence (EYFP; green), are surrounded by a small number of βIII-tubulin positive neurites (red). The graft was detected near the basal turn, at a position indicated (black arrowhead) in the schematic at right of c. Nuclei were visualized by DAPI staining (a–f; blue). Scale bar is 10 μm and applies to a–f. In d, mouse neural progenitor cells engrafted in the gerbil cochlea are shown at 12 days after transplantation. The cells expressing endogenous fluorescence (arrowheads in d; EYFP) and neuronal markers (arrowheads in e; βIII tubulin) remain in the nerve trunk, where they were injected, surrounded by abundant βIII tubulin immunopositive neurites. In the merged image (f), the cell bodies appear yellow because of overlap between EYFP and βIII tubulin staining (arrowheads in f). The position of the graft in the cochlear nerve trunk is indicated (black arrowhead) in the schematic to the right of f. New neurites stream from the EYFP-positive graft, through Rosenthal’s canal (white arrowheads in h and j) and the osseous spiral lamina and into the organ of Corti after 64 days (g–j) in low-power images of the graft region near the basal turn (immunostaining for each channel as indicated). The Inset shows a high-power view of the area indicated in the merged image: two surviving spiral ganglion cells (Pv3-positive; white arrows in i and Inset) can be seen, surrounded by radially directed neurites (Inset, white arrowheads), which do not connect to ganglion cell bodies, and appear directed to the organ of Corti where they appear to contact the hair cells (yellow arrowhead in Inset). The position of the graft is shown in the schematic at right of Inset. Scale bar in the merged image (200 μm) applies to g–j; in the inset, the scale bar is 50 μm. [Color figure can be viewed in the online issue, which is available at www.interscience.wiley.com.]