
Figure 3.
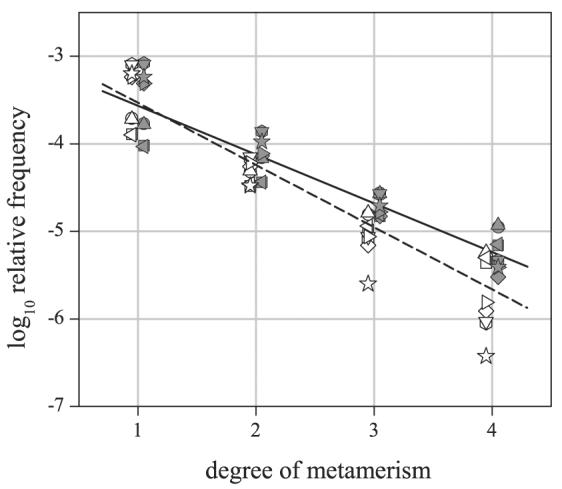
Log relative frequency of metameric pairs as a function of criterion degree of metamerism n, i.e., such that color differences ΔE were at least n times a nominal threshold ΔEthr. The illuminant change was from a daylight of correlated color temperature 25,000 K to one of 4000 K. Data for predominantly vegetated and nonvegetated scenes are shown by solid and open symbols, respectively, offset slightly for clarity. Solid and dashed straight lines are the corresponding linear regressions, excluding data from a simple CIELAB estimate (☆). Different models of color-difference measure,3, 27 chromatic adaptation,24 and nominal threshold6, 29 are indicated by different symbols (○CMCCAT2000, CIEDE2000, ΔEthr = 0.5;  CMCCAT2000, CIEDE2000, ΔEthr = 1.0; □ CMCCAT2000, CMC(1:c), ΔEthr = 0.5; ◇ CMCCAT2000, CMC(1:c), ΔEthr = 1.0; △ Sharp25 CMCCAT2000, CIEDE2000, ΔEthr = 0.5; ▽ Sharp CMCCAT2000, CIEDE2000, ΔEthr = 1.0; = ◁ Sharp CMCCAT2000, CMC(1:c), ΔEthr = 0.5; ▷ Sharp CMCCAT2000, CMC(1:c), ΔEthr = 1.0; ☆ CIELAB, ΔEthr = 1.0).