
Figure 5.
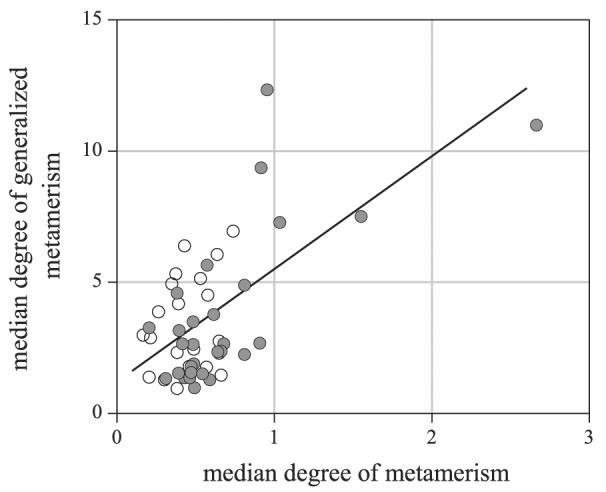
Relationship between generalized metamerism and metamerism. The median of the distribution of Δ2E for each scene under successive illuminants is plotted against the median of the distribution of Δ2E with ΔE1 < ΔEthr. Color differences ΔE1 under the first illuminant and second differences Δ2E (see text) were calculated with respect to CIEDE200023, 27; the adaptation model was CMCCAT2000,24 and the illuminant change was from a daylight of correlated color temperature 25,000 K to one of 4000K. The nominal color-difference threshold6, 29 ΔEthr = 0.5. Data from 29 predominantly vegetated scenes are shown by solid circles and from 21 predominantly nonvegetated scenes by open circles. The straight line is a linear regression.