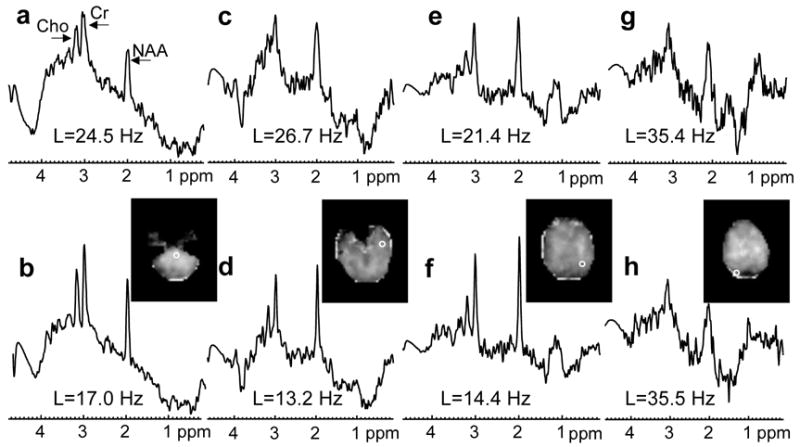
Figure 2.

Spectra from four voxels obtained from one volunteer studied at 4 T (same subject as in Fig. 1; TE=45 ms) processed without (a, c, e, g) and with B0-shift correction (b, d, f, h). Voxel locations are indicated in the image inserts showing fitted NAA area. The metabolite linewidth obtained by automated spectral analysis is denoted by L.
