
Figure 3.
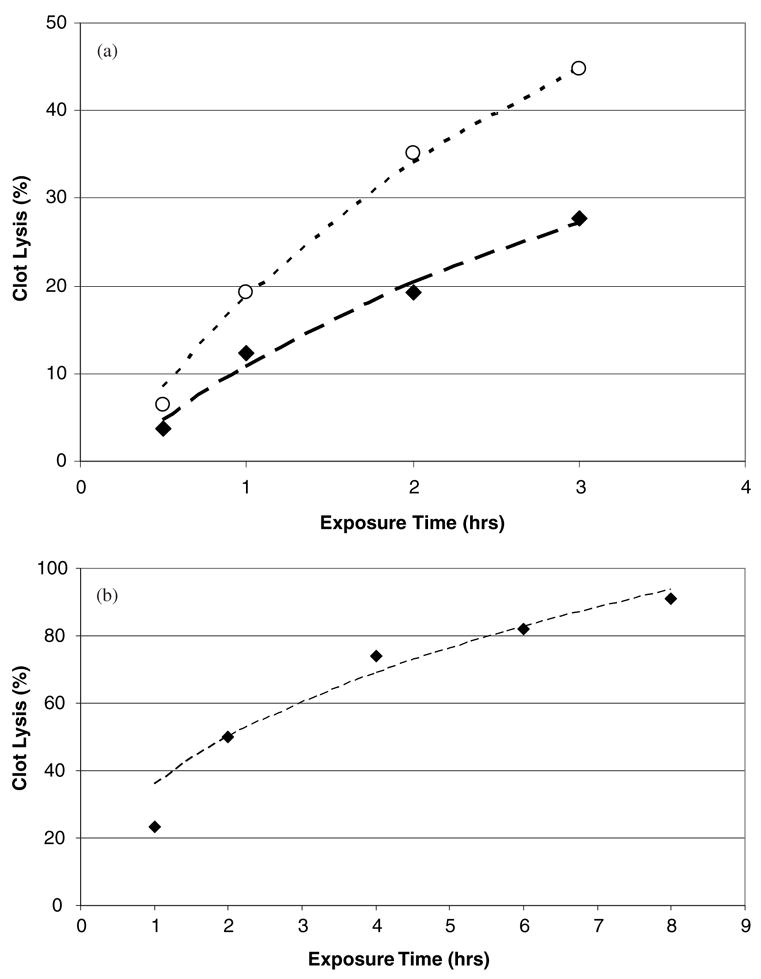
(a) Data from Trusen et al 1998 measuring tPA induced clot lysis in human whole blood clots and plasma. Data exhibited are for clots exposed to tPA at a concentration of 0.1 (◆) and 3 (○) μg ml−1 respectively. The lines are fits to the data of equation (37) and the agreement is excellent (R2 ⩾ 0.98). (b) Data from Onundarsen et al 1992 measuring tPA induced clot lysis in whole blood clots. Clots were exposed to a tPA concentration of 0.25 μg ml−1. The line is a fit to (37), and the agreement is quite good (R2 = 0.88).