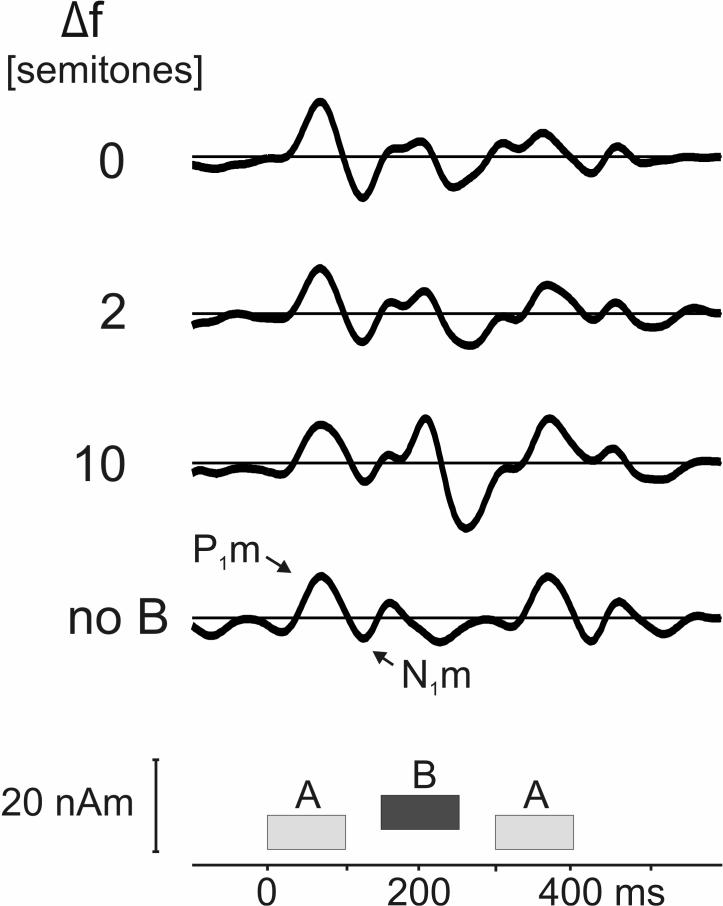
Fig. 6.
Average source waveforms from the auditory cortex of 14 listeners in response to ABA tone triplets with different A-B frequency separations (indicated in semitones on the left; they increase from top to bottom), and for a control condition in which the B tone was replaced by a silent gap (bottom trace). The P1m and N1m peaks evoked by the trailing A tone are labeled on the bottom trace. The three tones are represented schematically at their respective temporal positions underneath the traces. Each tone was 100 ms (including 10 ms ramps), the offset-to-onset interval-tone interval within each triplet, 50 ms, and the inter-triplet interval, 200 ms. The source waveforms shown here reflect activity originating from dipoles located in or near Heschl's gyrus (right and left hemispheres), as determined by spatiotemporal dipole source analysis (Scherg et al., 1990). Further methodological details can be found in Gutschalk et al. (2005). The main difference between the experiments described in that earlier study and that reported here is that, here, the A frequency was fixed and the B frequency variable – whereas the converse was true in Gutschalk et al. (2005).

