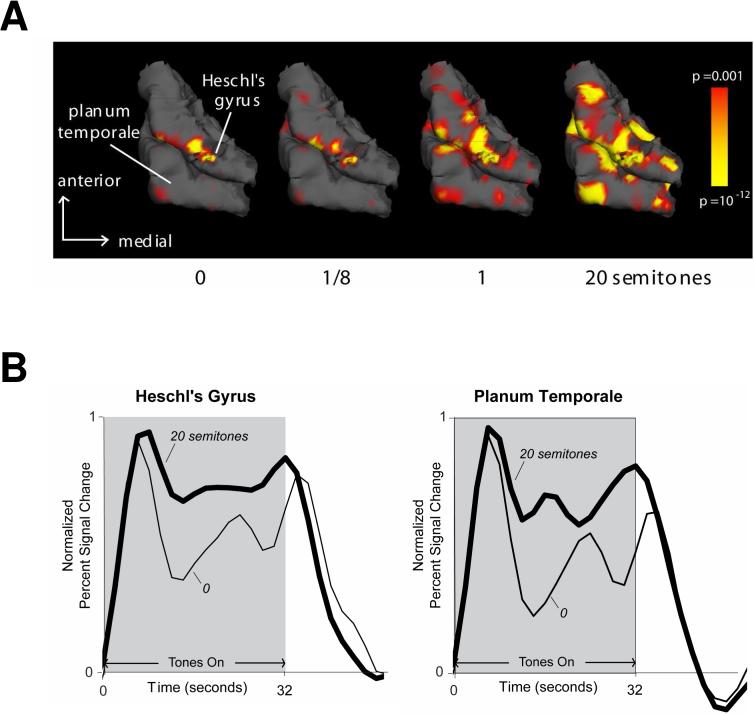
Fig. 7.
(A) Auditory cortex activation in response to repeating ABAB sequences for different A-B frequency separations. The activation is shown overlaid on a 3D reconstruction of the superior temporal lobe obtained from T1-weighted (∼1 × 1 × 1 mm resolution) images (MRPAGE). Stronger activation, corresponding to lower statistical p values, appears in bright yellow; weaker (albeit statistically significant) activation, in red. The data shown here are from a single listener, but typical of those obtained in a larger sample (Wilson et al., 2005). (B) Time courses of activation in auditory cortex for the tow extreme A-B frequency separations: 0 and 20 semitones.

