FIGURE 2.
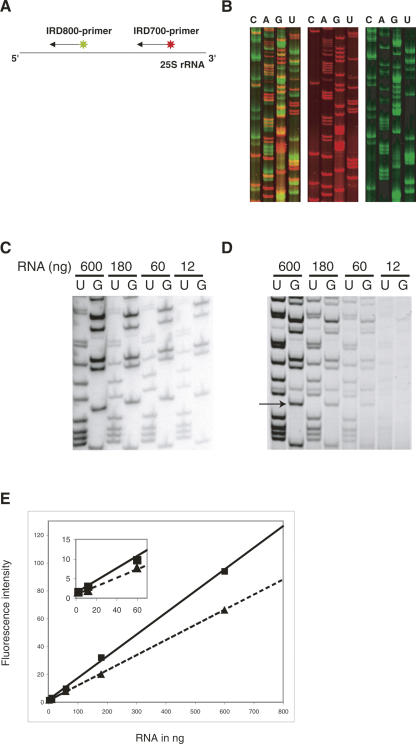
Sequencing of yeast ribosomal RNAs using FPE. (A) Schematic drawing of the double extension strategy. (B) Fluorescent imaging of sequencing of rRNAs using FPE. (Left) The gel scanned at both 700 nm (red) and 800 nm (green) wavelengths; (middle) the results at 700 nm (red), and right, at 800 nm (green). (C) Sequencing reactions performed within a 50-fold dilution range from 600 to 12 ng of RNA using internal radioactive labeling of the cDNA. (D) The same experiment using a primer labeled with a single IRD-700. (E) Linearity of the fluorescence signal within a 250-fold dilution range of 600–2.4 ng of RNA. Dashed and solid lines correspond to two different bands of cDNA that were quantified. One of the bands that has been quantified is indicated by an arrow in D. (Inset) Enlargement of the crowded region from 0 to 70 ng.

