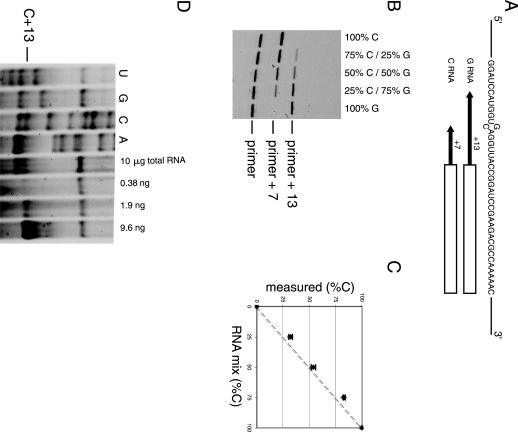
FIGURE 4.
Poisoned primer extension assay using IRD-700-labeled primer. (A) Sequence around the mutation site is shown. The box indicates the sequence complementary to the primer (23 mer) and the arrows indicate the extension until the first instance of C for each RNA. (B) Fluorescence scan of a polyacrylamide gel analyzing primer extension products of various G- and C-RNA mixtures. The primer, +7 (for C-RNA), and +13 (for G-RNA) products are indicated. (C) Population of C-RNA measured plotted against theoretical concentration. The dotted line represents the expected results if known and measured values are identical. The error bars represent the standard deviation of three independent experiments. (D) Polyacrylamide gel analyzing primer extension products of the mRNA. The four lanes on the left are sequencing ladders of in vitro transcribed mRNA. The position of the first C encountered by the reverse transcriptase in presence of ddGTP is indicated (C+13). The pause at C+13 was observed with 10 μg of total yeast RNA extract. The three lanes on the right show the pause at C+13 obtained on different quantities of in vitro transcribed RNA. These three lanes served as a crude calibration to estimate the intensity of the C+13 band obtained with 10 μg of total yeast RNA extract.

