Figure 3.

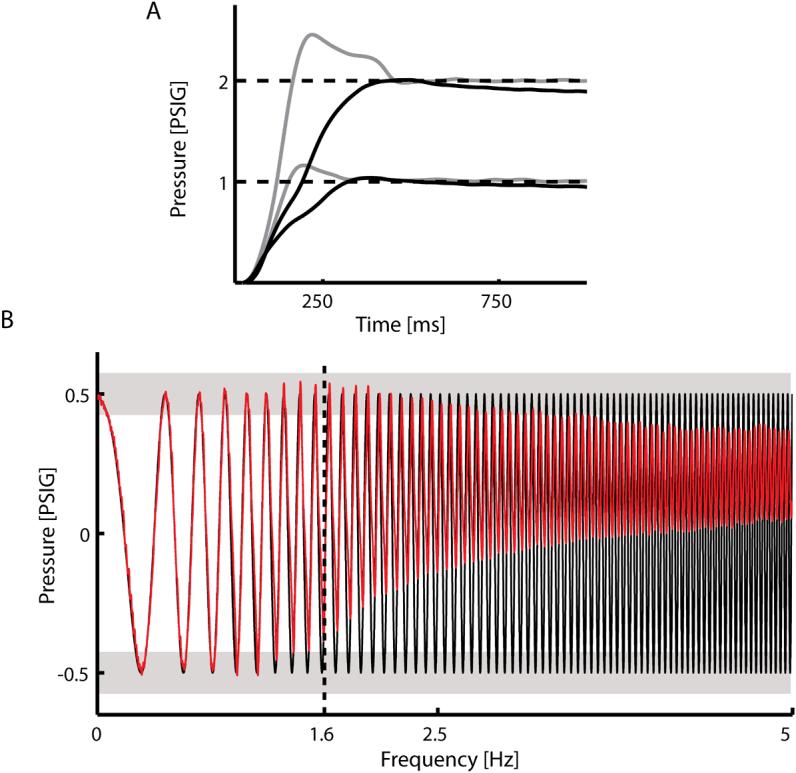
(A) Responses of the robot to 1 and 2 PSI step changes in pressure under open loop control (black lines) and closed loop PID control (gray lines). Response times decreased by 63% under PID control. (B) The frequency response of the system under closed loop PID control (red line) was identified by assessing the system's ability to track changes in commanded actuator pressure having a 1 PSI peak-to-peak ‘chirp’ profile sweeping from 0 to 5Hz (solid black line). The upper bound on the system's bandwidth was defined to be the frequency at which the controller was unable to regulate the actuator pressure within 15% of the peak commanded pressure (light gray bars). The system responses to the chirp perturbations revealed that the bandwidth of the device was at least 1.6 Hz under the simple PID controller described in the text.
