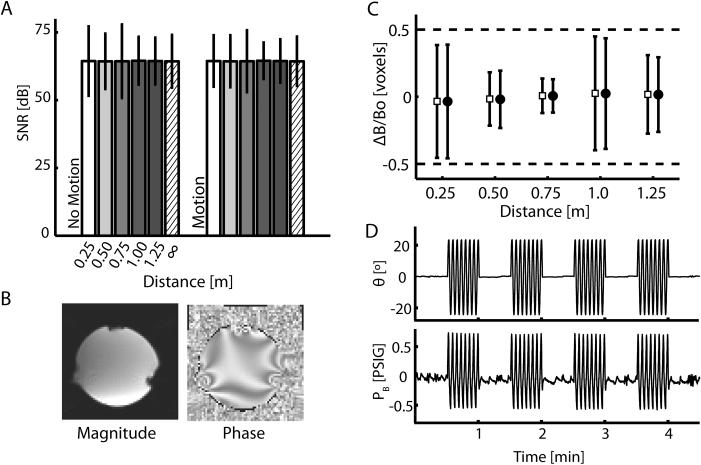
Figure 6.
(A) Signal to Noise ratio (SNR) for phantom ROI 3 (see Fig 1C) plotted against device operating distance from the center of the imaging volume. The SNR measurements were calculated from magnitude images. Within ROIs, SNR measurements were similar, demonstrating little effect of the robot on scanner performance in both the “No Motion” and “Motion” states. Because we were interested in how the mean SNR changed with distance in this case, error bars in this panel represent 95% confidence intervals about the mean SNR at each distance (i.e. ±2 SEM). (B) Sagittal slice of the magnitude and phase images of the phantom. Notice the susceptibility artifact bilaterally in the lower portion of the image caused by the presence of the phantom holder. This artifact was seen in images both with and without the manipulandum in the scanner. (C) Estimate of field homogeneity in ROI 3 from phase data collected in the “No Motion” (open squares) and “Motion” (filled circles) states. Because we were interested in the distribution of homogeneity values, error bars in this panel represent ± 2 standard deviations about the mean homogeneity and thus 95% of the data lie within these bounds. All values of DeltaB/Bo are within expected ranges of field uniformity. (D) Representative measurements of wrist angle and bellows pressure taken during the validation experiment where the device was 0.50m from the imaging volume. Pressure and volume measurements are not adversely effected by the operation of the MR scanner.

