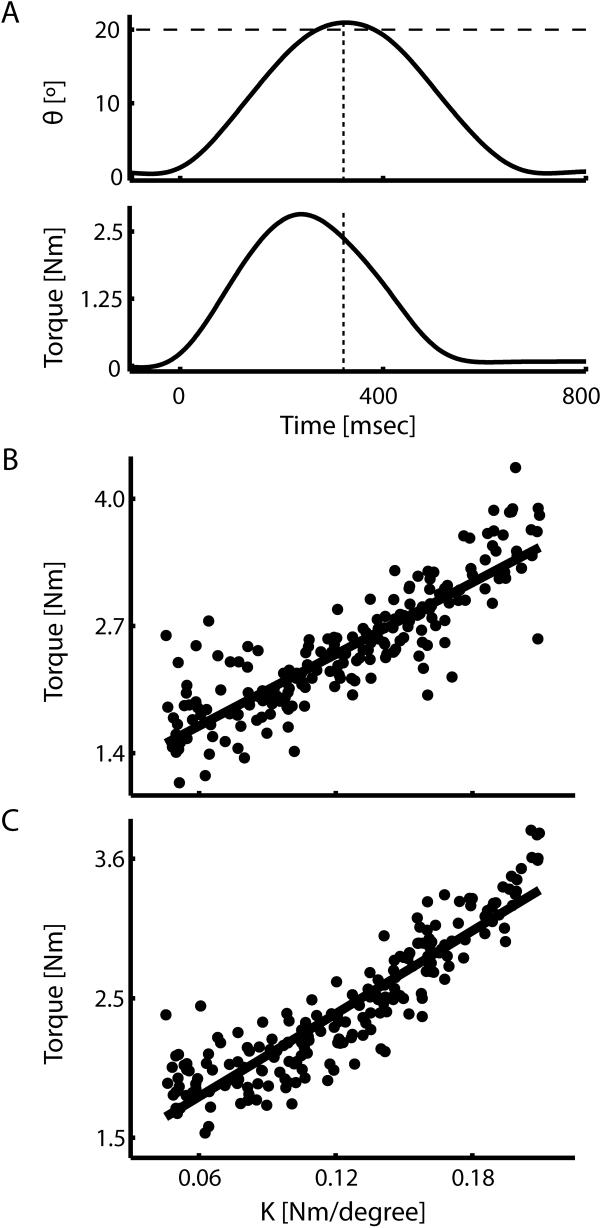
Figure 7.
Behavioral results of the psychophysical experiment. (A) Time series of wrist joint angle (top) and wrist torque (bottom) for a representative trial. The dotted vertical lines indicate the time at which maximum movement extent is achieved, while the dashed horizontal line indicates the target of the movement. (B and C) Scatterplots of individual trial joint torque values at maximum extent vs. perturbation strength for a representative subject (B) and averaged across all 20 subjects (C) were well-fit by a linear relationship (r2 = 0.76 and 0.82 for a representative subject and the study population, respectively).

