
Figure 1.
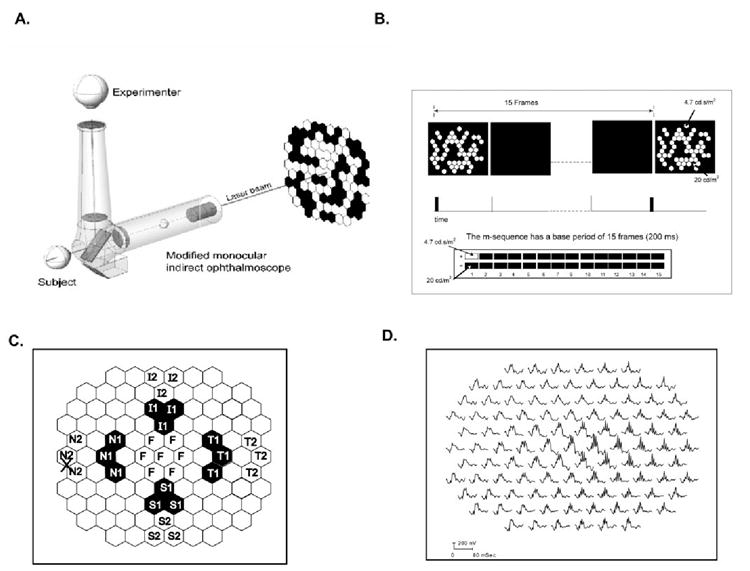
(A) The ophthalmoscopic technique used to center the fovea of the monkeys at the midpoint of the stimulus array (103 equal-sized hexagons). A monocular direct ophthalmoscope fitted with a laser was centered on the subject’s fovea and its position projected onto the stimulus monitor. (B) The slow-sequence paradigm used in the study had a base period of 15 frames, where every m-sequence was separated by at least 200 ms with 14 blank frames between. The stimulus energy for the white flashes was 4.7 cd-s/m2 and for the black was 20 cd/m2. (C) Multifocal stimulus display highlighting the retinal areas (chevrons) analyzed in this study (N1, N2: nasal; F, foveal; T1, T2, temporal; S1, S2, superior; and I1, I2: inferior retina).The labels represent the respective retinal locations. (D) Multifocal trace array from the left eye of a control monkey showing all 103 mfERG responses. The nasotemporal asymmetry in OPs can be seen clearly in this trace array.