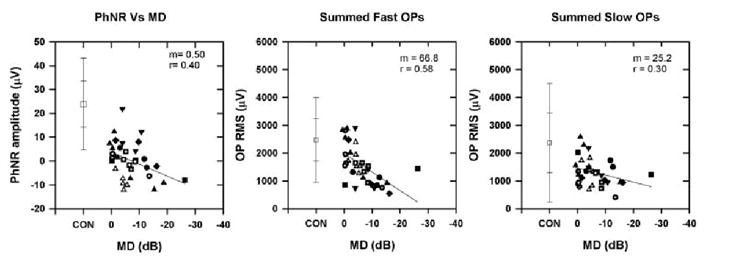
Figure 10.

Plot of PhNR amplitude (left), summed fast OP RMS (middle), and summed slow OP RMS (right) as a function of MD recorded from the eight animals with experimental glaucoma at different stages of glaucoma. The symbols are the same as in Figure 7 and represent the different animals. The slope (m) and correlation coefficient (r) are shown at the top of the plots. Error bars, ±1 and ±2 SD.
