
Figure 5.
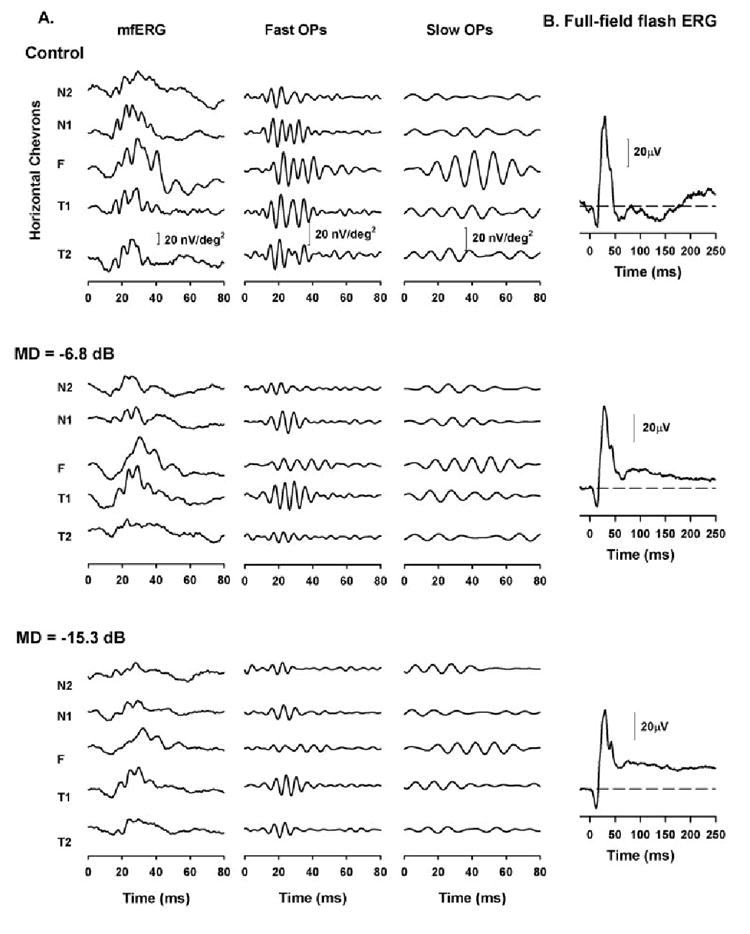
(A) Effect of experimental glaucoma on the slow-sequence mfERG on a representative animal (OHT-39). Left column: slow-sequence mfERG obtained for the five horizontal retinal locations; middle column: extracted fast OPs; right column: the extracted slow OPs for the five locations. Top: slow-sequence mfERGs, OPs, and OP RMS obtained from the right eye of this animal before induction of experimental glaucoma. Middle: same eye, 15 months after laser-induced experimental glaucoma with an MD of −6.8 dB; bottom: same eye, 16 months after laser-induced experimental glaucoma with an MD of −15.3 dB. (B) Full-field ERG for a 1.6 log td-s stimulus to elicit PhNRs recorded during the same experimental session in which the mfERGs were recorded.