
Figure 6.
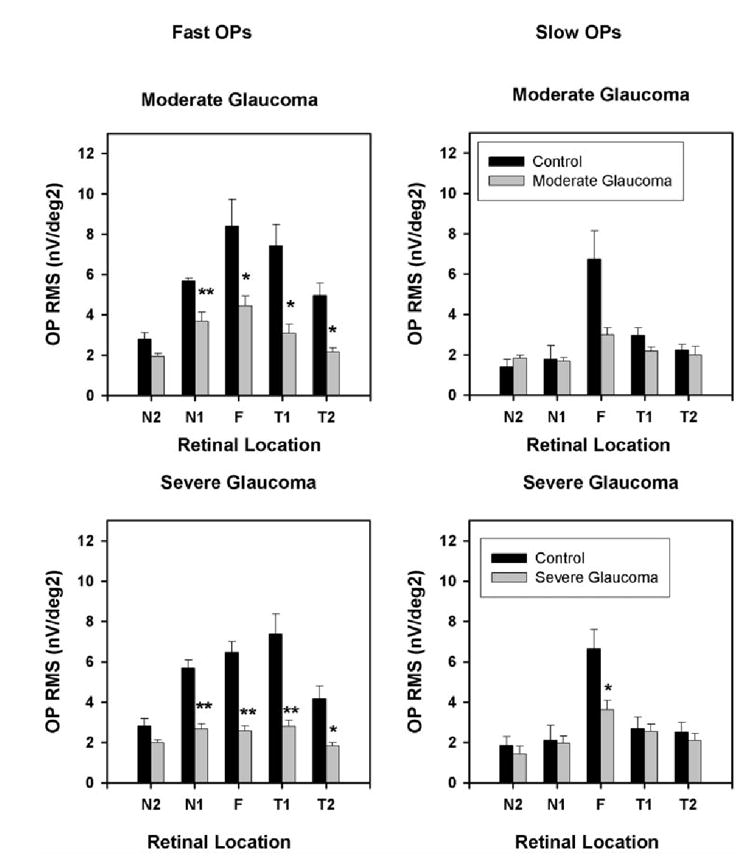
Mean fast (left) and slow (right) OP RMS corresponding to the horizontal five chevrons for control and moderate (top) and control and severe (bottom) glaucoma. The control data were from the left eye of the six monkeys with unilateral glaucoma from the same experimental session and from the left eye before induction of glaucoma in two monkeys with bilateral glaucoma. Error bars, ±1 SEM.