
Figure 7.
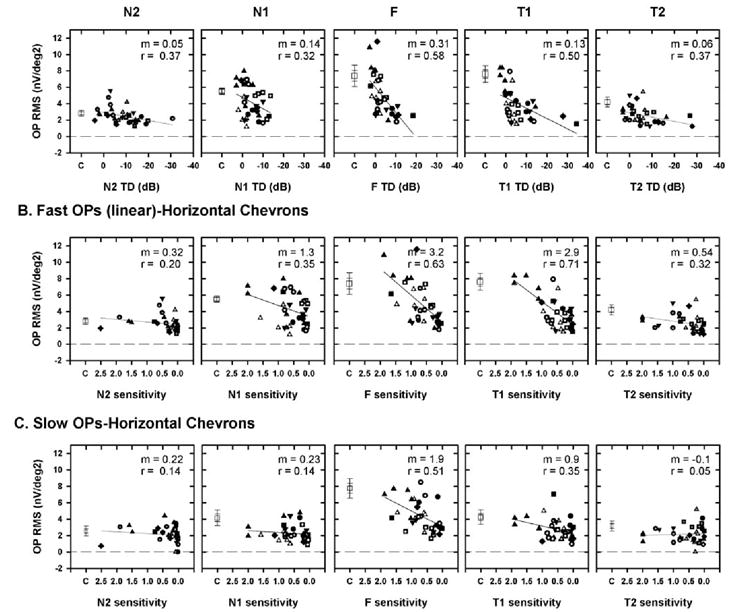
(A) Plot of the fast OP RMS of the signal as a function of visual field defect for the five horizontal chevrons, with the TD expressed in decibels (A) or as linear (proportion of the sensitivity of the control) sensitivity (B). (C) Plot of slow OP RMS signal as a function of visual field sensitivity expressed as a proportion of the control sensitivity. Symbols represent data from different animals. (◻) The mean of the OP RMS of the signal for the control eyes. Dashed line: a line through RMS = 0 to indicate that noise was removed. The slope (m) and correlation coefficient (r) for the OP RMS signal as a function of TD are shown at the top right of each plot. In contrast to the sensitivity on the abscissa, at the RMS on the ordinate was expressed as a calculated value and not as a proportion. Expressing the OP RMS as a proportion compressed the values, making changes in the OP RMS that occurred for small visual field defects difficult to determine (data not shown). Error bars: ±1 and 2 SEM