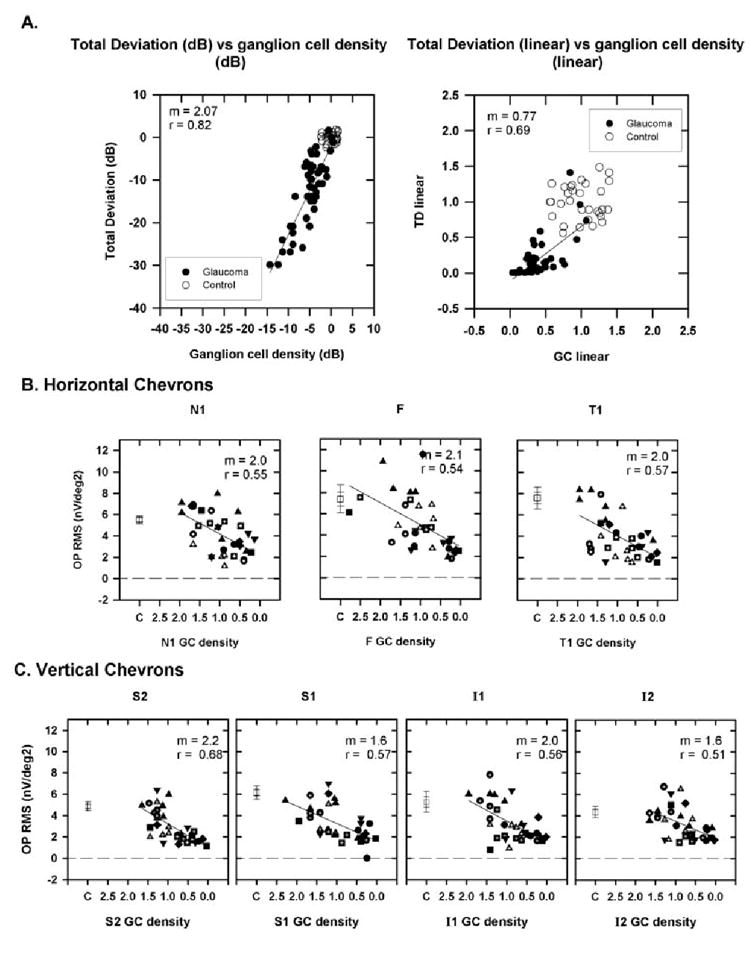
Figure 9.

(A) Plot of TD as a function of ganglion cell (GC) density for a location with coordinates (x, y = 15°, 15°) is shown as an example calculated using equations 1 to 3 from Harwerth and Quigley41 for the monkeys used in the current study. Left: both TD and GC density are expressed in decibels; right: both are expressed as a proportion of control. Data are from (○) control and (●) glaucomatous eyes. (B) The fast OP RMS signal as a function of ganglion cell density calculated for the locations corresponding to the chevrons for N1, F, and T1. Data for N2 and T2 are not shown because changes in the fast OPs were small (see Fig. 7, Table 2). (C) The fast OP RMS signal as a function of ganglion cell density for vertical chevrons (S2, S1, I1, and I2). Symbols: as described in Figure 7. The slope (m) and correlation co-efficient (r) for the OP RMS signal as a function of GC density are shown at the top right of each plot. Error bars, ±1 and ±2 SEM.
