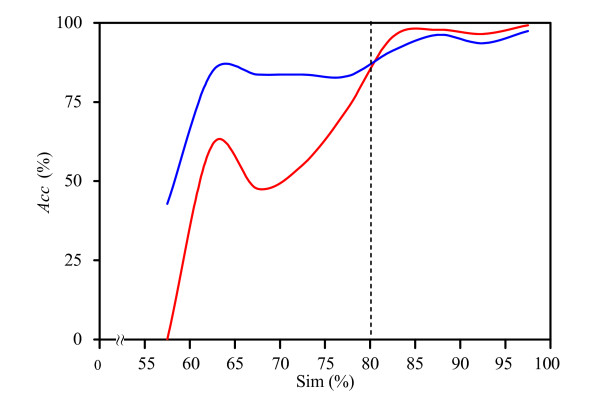
Figure 2.
The distribution of the prediction accuracy as a function of secondary structure similarity. The blue line and the red line indicate the distribution of the prediction accuracy as a function of secondary structure similarity for PSL101 and PSLsse using cross-validation for the PS1444 data set, respectively.

