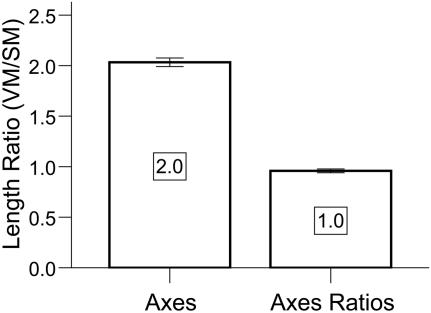
Figure 3. Validation of Processing Pathway.
The stereolithographic model preserved the VM:SM average axes scaling factor of 2:1 [Mean+/−SEM = 2.03+/−0.04; t(2) = 0.79;p = 0.51, 2-tailed] and the 1:1 average axes proportion [Mean+/−SEM = 0.96+/−0.02; t(2) = −2.2;p = 0.16, 2-tailed]. Error bars are SEM.

