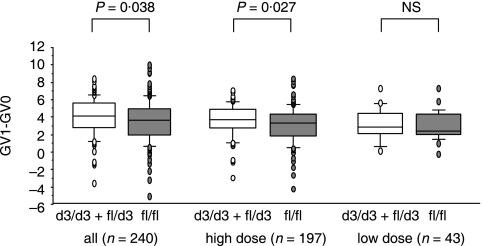
Fig. 1.
Change in growth velocity during the first year of GH treatment in the 240 SGA children according to the dose of rhGH: high dose 0·43 ± 0·17 mg/kg/week; low dose 0·21 ± 0·04 mg/kg/week. Results are presented as boxes with the horizontal line inside the box representing the mean and the vertical line representing the interquartile range (10th–90th centiles). The extreme values are presented as circles. The d3/d3 + fl/d3 group (or D group) is in white and the fl/fl group is in grey.

