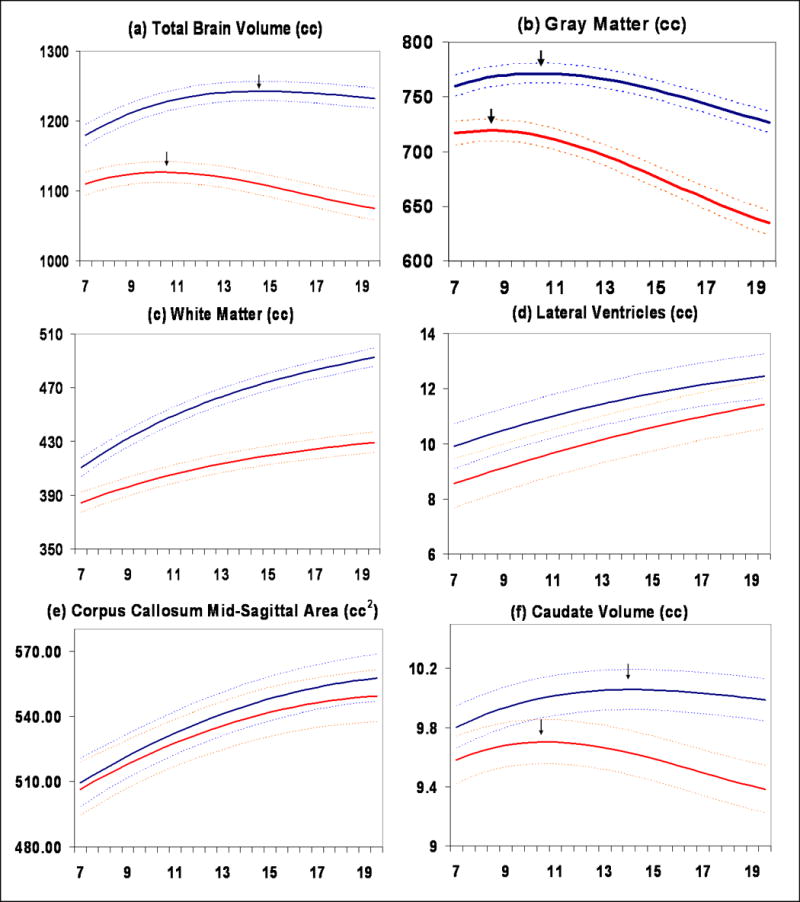
Figure 2.

Mean volume by age in years for males (N = 475 scans) and females (N = 354 scans). Middle lines in each set of three lines represent mean values, and upper and lower lines represent upper and lower 95% confidence intervals. All curves differed significantly in height and shape with the exception of lateral ventricles, in which only height was different, and mid-sagittal area of the corpus callosum, in which neither height nor shape were different. (a) Total brain volume, (b) Gray matter volume, (c) White matter volume, (d) Lateral ventricle volume, (e) Mid-sagittal area of the corpus callosum, (f) Caudate volume
