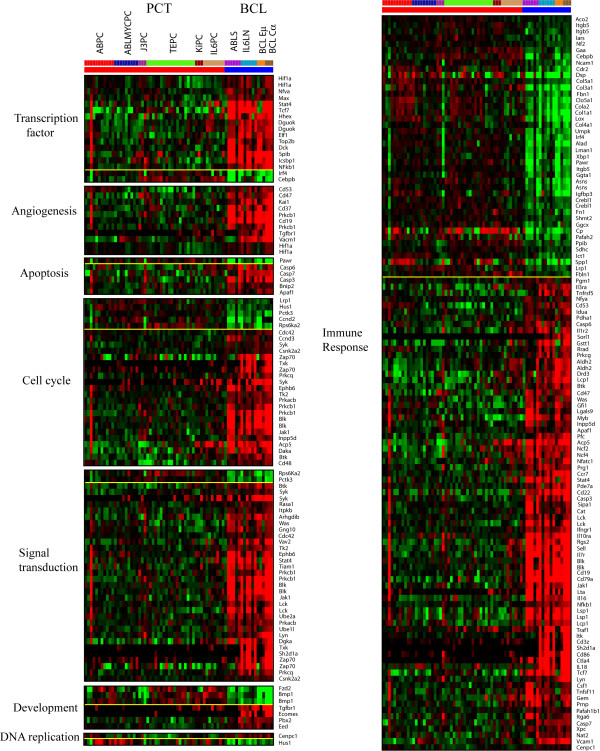
Figure 2.
Genes showing significant differences in expression between PCTs and BCLs. Class comparison between PCTs and BCLs showed 926 genes that showed significant differences (p < 1 × 10⁻⁵) in two sample t-test. The genes assigned to 8 different functional categories by CGAP are presented as a heat map of gene cluster. Additional details can be found in Additional file 1.

