
Figure 1.
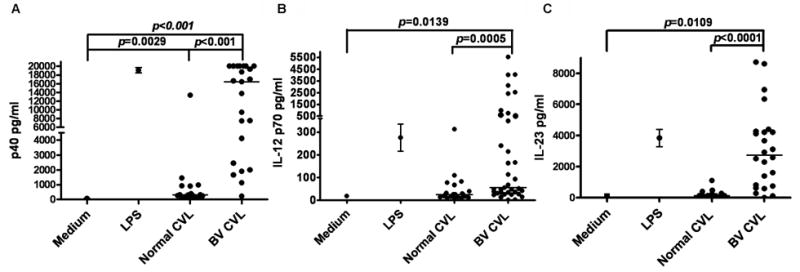
Cytokine production of MDDCs induced by CVL samples. (A) Individual CVL sample induction of IL-12 p40, (B) IL-12 p70 and (C) IL-23. CVL samples were incubated with MDDC for 24hr. Culture supernatants were harvested and cytokine levels measured by ELISA. Each point represents the average of three experiments, the line indicates the median value of each group. p values were determined by Mann Whitney.