
Figure 2.
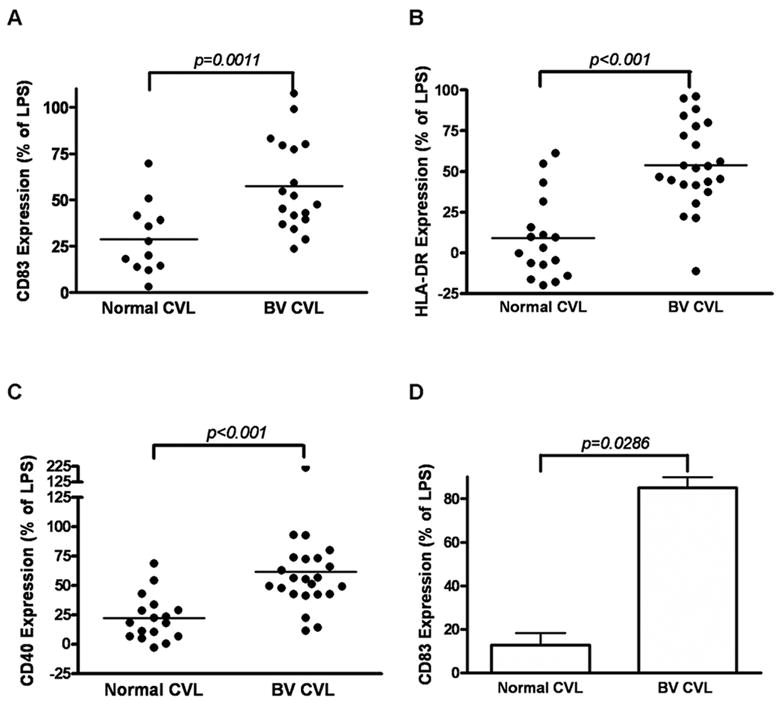
Effect of mucosal fluids on levels of MDDC cell-surface markers of activation and maturation. MDDCs were incubated with CVL samples from individual patient samples (A, B, C) or pooled CVL samples (pools of all 17 normal CVL samples from and all 23 BV CVL samples) (D). Expression (Mean Fluorescence Intensity) of CD83 (A, D) HLA-DR (B) and CD40 (C). Data were adjusted to % of the LPS positive control (100%) and medium treatment (0%) and each point is the average of two independent experiments. The line in figs A,B,C represents the median value of each group, and D is Mean +SEM. p values were determined by Mann Whitney..