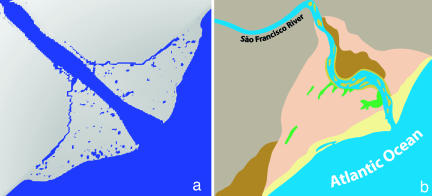
Fig. 5.
Comparison of the simulation results (a) with a real map (b). (a) Simulation of a wave-dominated delta. While the waves are reworking the coast at the mouth of the river to form an estuary, the river deposits sediment and forms large beaches. Because the simulation does not include evaporation, the ponds and inactive channels in the deposition zone do not disappear as in the map of the real river shown in b. The parameters in the simulation were n = 179, I0 = 1.7 × 10⁻⁴, s0 = 0.0015, cσ = 8.5, c1 = 0, c2 = 0.1, and I* = 1.3 × 10⁻⁴. Smoothening was applied every 200 time steps with a smoothening constant ε = 0.01. (b) A map of the São Francisco River delta in southern Brazil, which is the most wave-dominated delta according to the classification of ref. 41. The colors in the map (b) indicate channel deposits (mustard), beach ridges (peach), eolian dunes (yellow), marsh-mangroves (green), the floodplain (brown), and the uplands (tan). The figure was redrawn from ref. 35.

