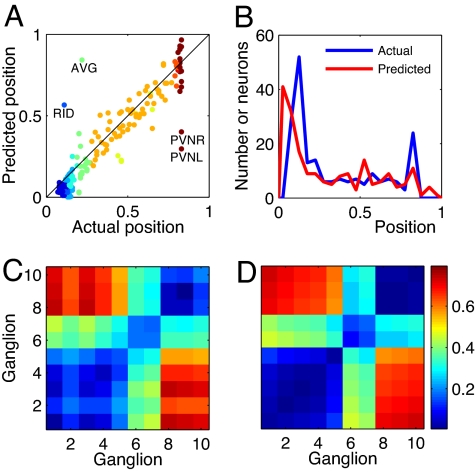
Fig. 3.
Connections among sensory and motor neurons improve predicted clusters. (A) Optimal positions of sensory and motor neurons, obtained by minimizing their connections to organs and among themselves, versus their actual positions. Colors distinguish different ganglia. (B) Neuron density along the nematode, for actual and optimal positions. (C) Average distance between neurons belonging to the same ganglion (diagonal elements) or different ganglia (nondiagonal elements) for optimized sensory and motor neuron positions. (D) Same as C but for the actual nematode.

