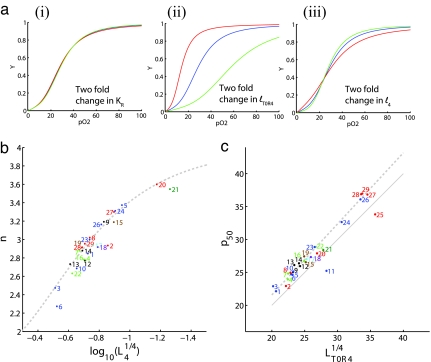
Fig. 3.
Relationship of microscopic parameters to phenotypic saturation properties. (a) Sensitivity of the saturation curve to different parameter changes. Normal human saturation curve (blue) versus 2-fold increase (red) or decrease (green) in the value of KR while keeping L4 and KT constant (i); KT (equivalently lT0R4) while keeping L4 and KR constant (ii); and l4 while keeping KR and LT0R4 constant (iii). We use the notation lT0R4 = LT0R41/4 and l4 = L41/4 as explained in SI Text. (b) The cooperativity n depends strongly on L4. Parameters based on nonlinear least-squares curve fitting are shown for different organisms. The gray dotted line shows the theoretical relationship given in the text and is derived in SI Text. (c) The half-saturation pressure, p50, depends strongly on LT0R4. Values of the parameters for different organisms are shown. The thick dotted line shows the first-order theoretical relationship given in the text; the thin dotted line shows the second-order approximation. For full derivations, see SI Text. Mammals' index legends are as in Fig. 2b pO2 and pO5 are in units of mmHg.

