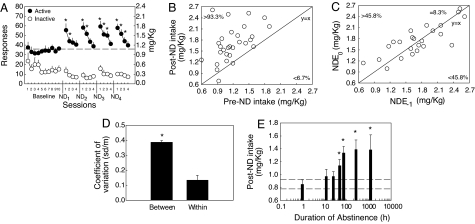
Fig. 2.
Characterization of the nicotine-deprivation effect. (A) Total (23-h) active and inactive responses after repeated cycles of 72 h of nicotine deprivation (ND), followed by 4 days of self-administration (*, P < 0.05 vs. baseline). (B) Robustness of the nicotine-deprivation effect. Scatter plot of nicotine intakes observed during the first session before (pre-ND) and after (post-ND) each of the four cycles of nicotine deprivation. The numbers represent the percentage of measures above and below the y = x line. (C) Reliability of the nicotine-deprivation effect. Correlation of post-ND nicotine intakes between each of the four cycles (ND(−1) vs. ND(0) = ND1 vs. ND2, ND2 vs. ND3, and ND3 vs. ND4). (D) Coefficient of variation of post-ND intakes between subjects vs. within subjects (*, P < 0.05). (E) Effect of duration of abstinence (h) on active responses during the subsequent 12-h period of nicotine access. (*, P < 0.05 vs. 1 h). Note logarithmic time scale. Dotted lines represent mean ± SEM of the 1-h time point (*, P < 0.05 vs. 1 h). Data represent mean ± SEM.

