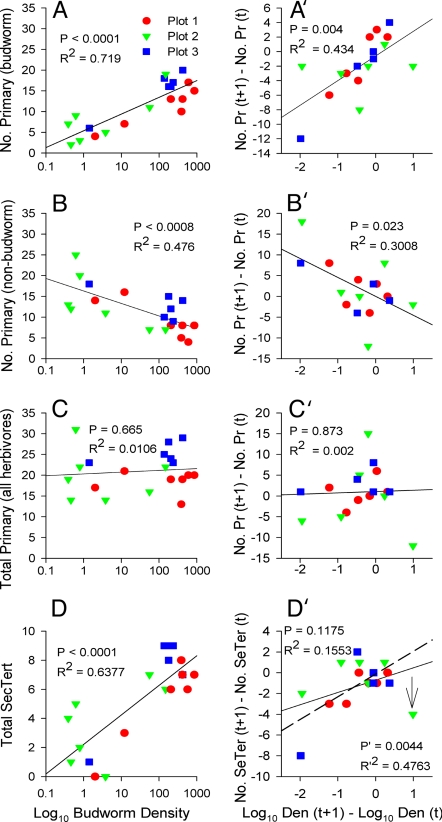
Fig. 2.
Food-web diversity and budworm density. A–D are based on untransformed data, and A′–D′ are based on transformed data. Similar results were obtained by both methods. (A) Number of primary parasitoids attacking only budworm increases significantly with increasing budworm density. (B) Number of primary parasitoids attacking one or more non-budworm herbivores decreases significantly with increasing budworm density. (C) Total number of primary parasitoids attacking all herbivores does not change in response to increasing budworm density. (D) Total number of secondary and tertiary parasitoids increases significantly with increasing budworm density. Results in D′ are not significant. This is mainly because of an “outlier” (indicated by arrow) caused by a sharp increase in budworm (second-instar budworm) density in Plot 2 in 1990 (see SI Fig. 6). This increase was caused by an invasion of budworm adults (moths) into the plot in 1989 from an other location(s). These invading moths laid eggs, thereby augmenting the local egg populations, resulting in a much greater number of budworm (second-instar budworm) in the following spring (1990) than normally would have occurred that year. This “artificial” (positive) deviation from the local host population trend did not result in a corresponding positive response by the secondary and tertiary parasitoid complex (i.e., parasitoid numbers continued to decline as expected from the trend). Results were significant when “outlier” was removed (dashed line; note P and R2 values in D′). (In A–D, n = 20; in A′–D′, n = 17). SecTert and SeTer, secondary and tertiary; Pr, primary; Den, density.

