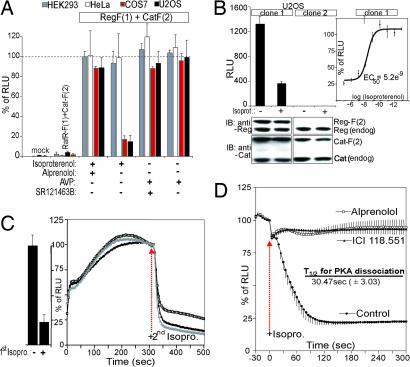
Fig. 5.
Identification of endogenously expressed GPCR cascades using the Rluc-PCA PKA reporter. (A) The Rluc-PCA was detected from attached HEK293T, HeLa, COS7, or U2OS cells grown on white-walled 96-well microtiter plates. Shown is the effect of combinations of alprenolol (10 μM, 60 min) pretreatment and isoproterenol (10 μM, 15 min) treatment and combinations of SR121463B (1 μM, 60 min) pretreatment and AVP (100 nM, 15 min) treatment on Reg-F(1):Cat-F(2) (mean ± SD from three independent experiments). (B) The Rluc-PCA was detected from U2OS cells stably expressing Reg-F(1):Cat-F(2) in the presence and absence of isoproterenol (1 μM) (Left). Immunoblot analysis verifies the expression of endogenously expressed and overexpressed regulatory and catalytic PKA subunits. EC50 values for isoproterenol-mediated β-adrenergic activation were obtained by using increasing concentrations of the ligand measured as changes of Reg-F(1):Cat-F(2) (Right; mean ± SD from three independent experiments). (C) Real-time kinetics (normalized on the control experiment) in response to isoproterenol (1 μM) of Reg-F(1):Cat-F(2) recorded with attached U2OS cells (stable clone 1; three independent samples, representative experiment). Washing steps were performed four times with PBS after 10 min of first isoproterenol treatment. (D) Real-time kinetics (normalized on the control experiment) of changes of Reg-F(1):Cat-F(2) recorded with attached U2OS cells (stable clone 1) when treated with combinations of ICI118,551, alprenolol (both 10 μM, pretreatment 60 min), and isoproterenol (1 μM). Half-times of PKA dissociation were calculated from three independent experiments (mean ± SD). Calculation of EC50 and t1/2 values and curve fittings were done with Prism 3.01 (GraphPad) (mean ± SD from at least three independent samples).

