
Figure 2.
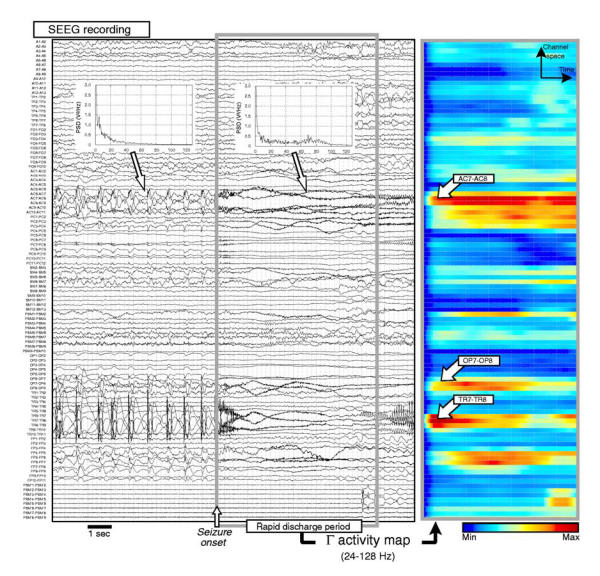
a) example of intracerebral recording performed during SEEG exploration (patient TAL). Seizure begins precisely during the abrupt change in the activity reflected by signals (transition from sustained discharge of high amplitude spikes to a low voltage rapid discharge expressing in the gamma band of the EEG, as revealed by power spectral densities computed before and after seizure onset), b) Γ-activity map computed over a seven second period starting from seizure onset. A color-coding is used to represent the power in the upper frequency band (24 to 128 Hz) as a function of both time and space (recording channels). In this example, on three electrodes (AC, TR and OP) respectively recording the superior frontal sulcus (BA9 and BA9/46) and operculo-frontal region, bipolar signals AC7-AC8, TR7-TR8 and OP7-OP8 exhibit fast activity revealed by high power in the Γ sub-band (red color). A depicted on the map, very fast oscillations may appear quasi-simultaneously in distinct neural sites.