
Figure 4.
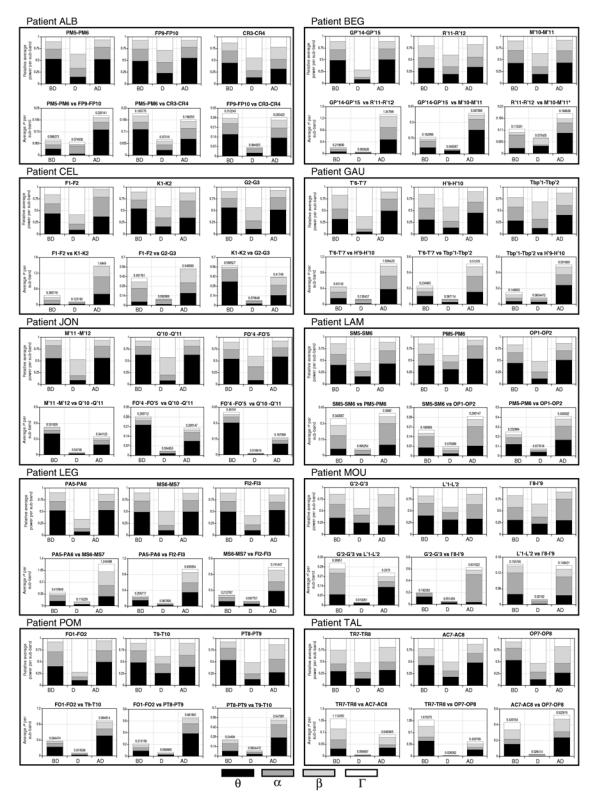
Relative power and spatio-temporal correlations measured in the ten studied patients. In all patients, power distribution changes as a function of the considered period (upper frequency band Γ becomes predominant during the low voltage rapid discharge). In all patients, r2 values estimated over the discharge period are lower than those measured before and after this period, denoting the appearance of a spatial decorrelation.