
Fig. 4. Modulation of endogenous gene expression by hERα and hERβ.
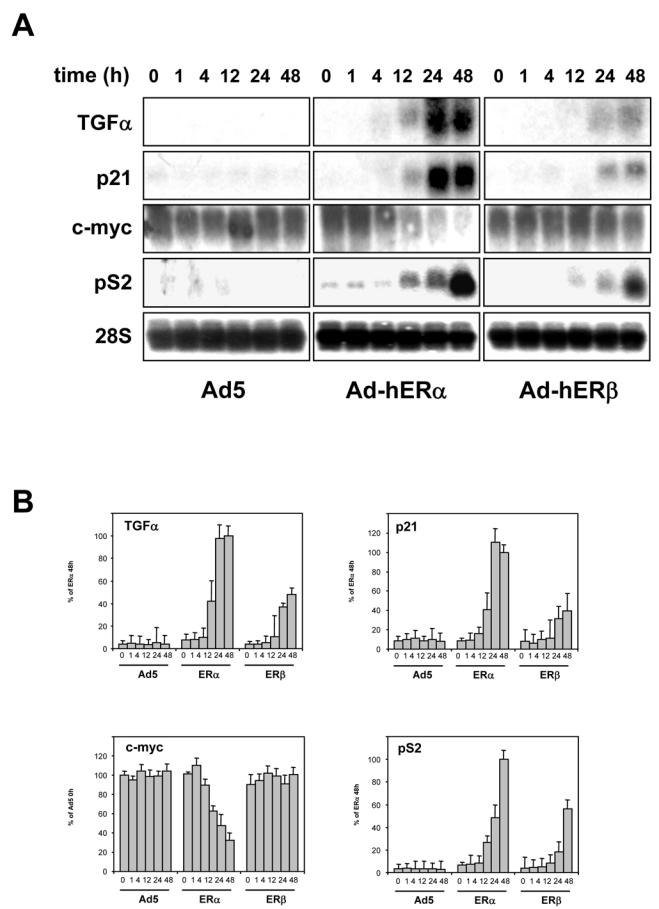
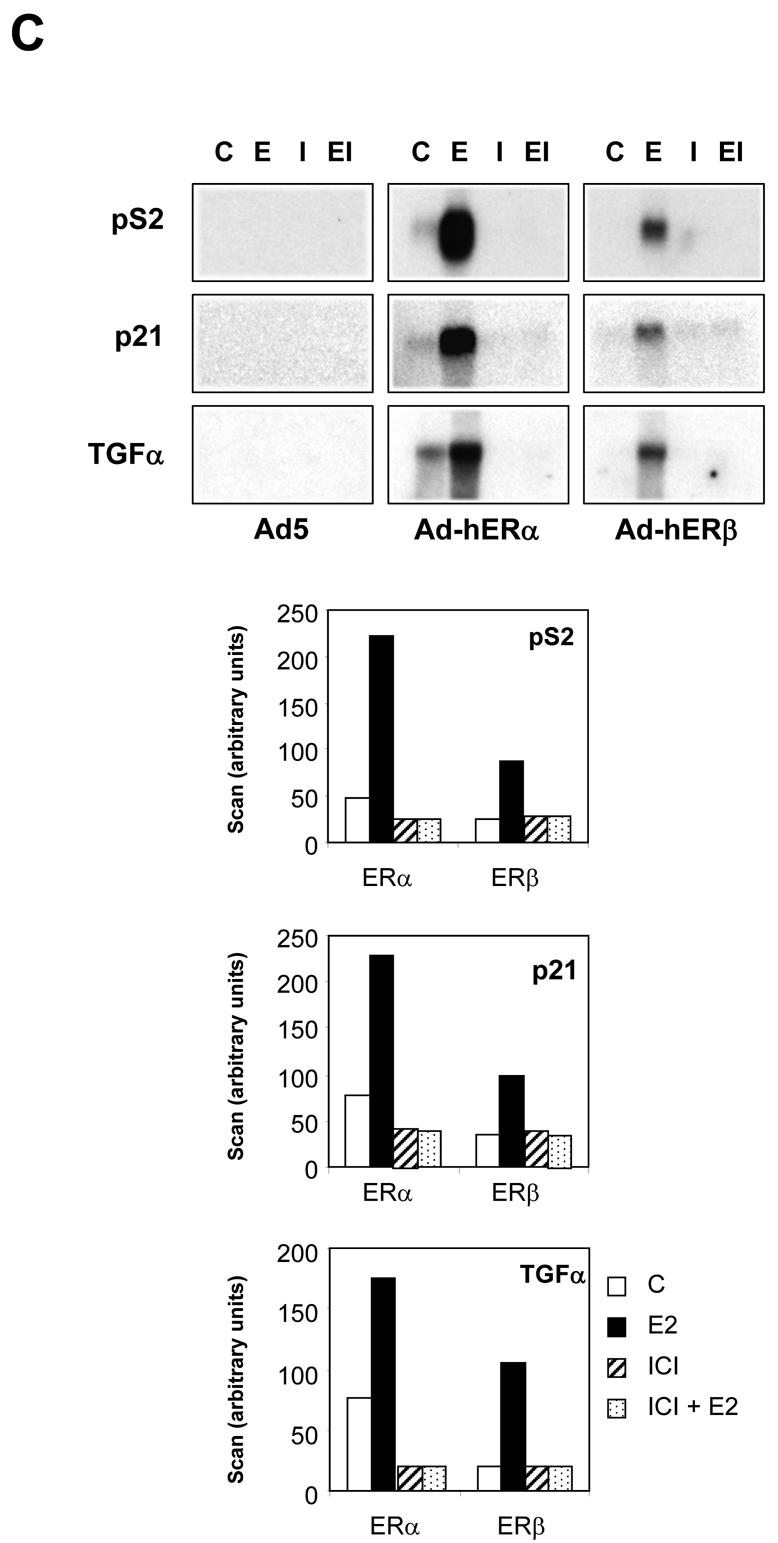
MDA-MB-231 cells were infected at MOI 100 with the different viruses. 24 h after infection, the E2 treatment began sequentially. All cells were harvested at the same moment following different times of E2 exposure and RNA extracted. 20 μg of total RNA were used for Northern blot and hybridized with TGFα, p21, c-myc or pS2 probes. Equal loading was checked with an RNA 28S probe. Data of a representative experiment are shown here. B. Quantification of Northern experiments after normalization by 28S RNA levels. Results are the mean ± SD (n = 3) of 3 experiments. C. The same experiments were performed in the presence of control vehicle ethanol (C), E2 (10−8M) (E), ICI 164,384 (10−6M) alone (I) or in combination (EI). Data of a representative experiment are shown here and the quantification after normalization with 28S RNA is indicated below. Results are expressed in arbitrary units of scan.