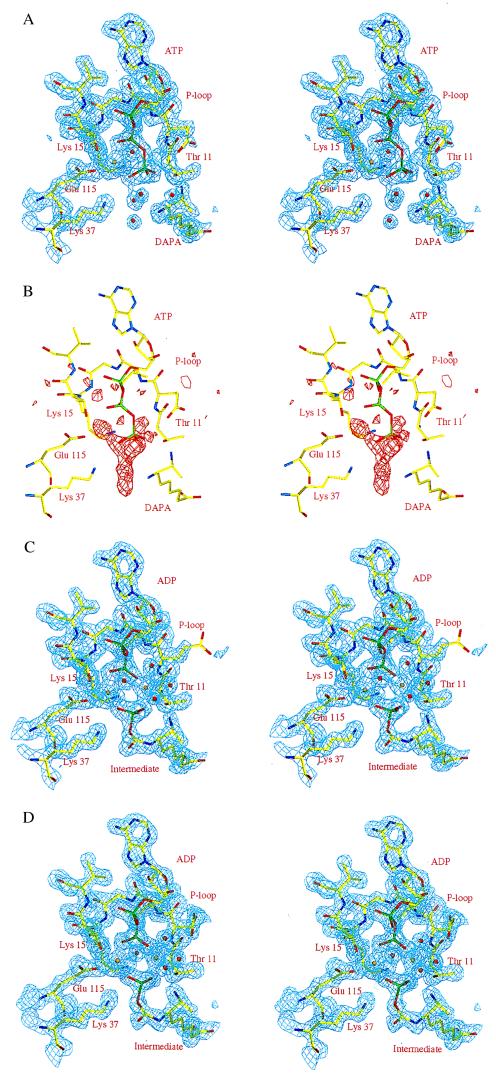
Figure 3.
(A) Stereo view of the refined 2Fo-Fc electron density map (contoured at 1.2σ) at the active site of the DTBS–MgATP–DAPA complex (t = 0). The structural model of the refined complex is superposed. (B) Stereo view of a Fo − Fc electron density map (contoured at 3σ), covering the same part of the active site, calculated with data collected 80 s after reaction initiation (experiment A). The electron density map was calculated with phases from the DTBS–MgATP–DAPA complex, excluding active site solvent molecules, the γ-phosphate, and the metal ion from the structure factor calculation. The structure of the DTBS–MgATP–DAPA complex is superimposed. (C) Stereo view of the refined 2Fo − Fc electron density map (contoured at 1.2σ) for the DTBS–MgADP–intermediate (t = 80 s) complex, same view as above (experiment A). A model of the refined DTBS–MgADP–carbamic–phosphoric acid anhydride complex is included. (D) Stereo view of the refined 2Fo − Fc electron density map (contoured at 1.2σ) for the DTBS–MgADP–intermediate complex, obtained from experiment B. A model of the refined DTBS–MgADP–carbamic–phosphoric acid anhydride complex is included. Golden spheres indicate magnesium ions, and red spheres indicate solvent molecules

