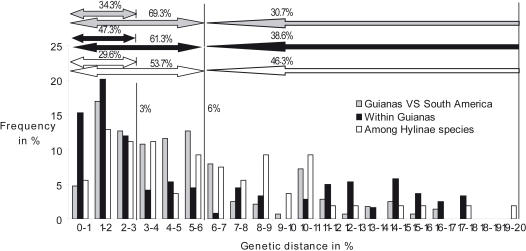
Figure 2. A histogram showing the distribution of the pairwise genetic distances among (1) conspecific populations from the Guianas versus other populations in South America (Grey), (2) conspecific populations within Guianas (Black), (3) closest Hylinae species from the dataset of Faivovich et al. (2005) (White).
The arrows above the histogram provide summary data showing the proportion of distances in each of the three categories situated between 0 and 3%, 0 and 6% and above 6%.

