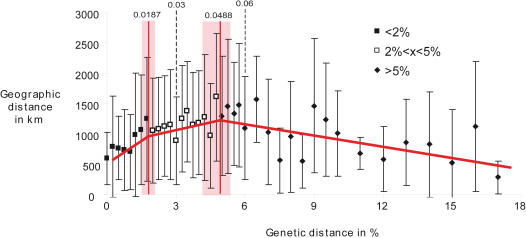
Figure 3. The distribution of the pairwise genetic distances among conspecific populations against geographical distances (N = 822).
Genetic data are segregated by 0.025% classes from 0 to 6%, by 0.5% classes from 6 to 10% and then by 1% for higher values. Linear models computed from the distribution of the raw data.

