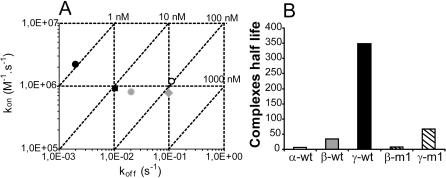
Figure 5. Association and dissociation rate constant of the CXCL12-GAG interaction.
(A) Graphical summary of the data generated from the sensorgrams of Fig. 4, in which association (kon) and dissociation (koff) rate constants of CXCL12α (open circle), β (grey circle), β-m1 (grey square), γ (black circle) and γ-m1 (black square) for HP were determined as described. Differences were essentially observed along the koff axis. (B) Dissociative half live of the different CXCL12/HP complexes.

