
Fig. 1.
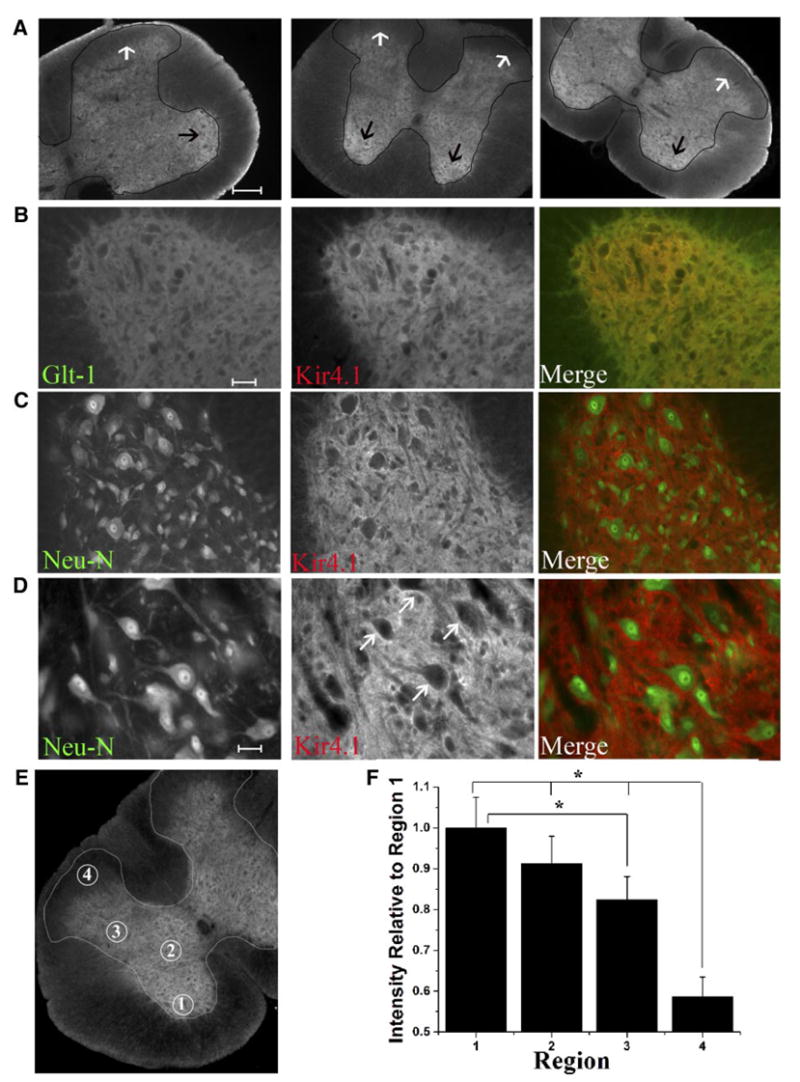
Immunohistochemistry demonstrates highest Kir4.1 staining in the ventral horn with very low immunoreactivity in the apex of the dorsal horn. A: low-magnification images from different regions of the spinal cord demonstrate highest Kir4.1 immunoreactivity in the ventral horn and very little staining visible in the dorsal horn of the spinal cord. The gray matter is lightly outlined in black for visualization. The black arrows indicate the ventral horn, the region of the cord that labels most intensely for Kir4.1. The white arrows indicate the superficial layers of the dorsal horn which demonstrates little Kir4.1 immunoreactivity. B: images from the ventral horn demonstrating Kir 4.1 largely overlapped with GLT-1 as demonstrated by the yellow color in the merged image. C: Kir4.1 and Neu-N labeling appear distinct in the ventral horn. D: high-magnification images from the ventral horn demonstrate Kir4.1 staining is most intense surrounding neuronal cell bodies. (Scale bars A, 200 μm, B and C, 100 μm, G, 50 μm). E: circled regions in this image correspond to Rexed’s Laminae IX (region1), Rexed’s Laminae VII (region 2), Rexed’s Laminae V (region 3), and Rexed’s Laminae I/II (region 4); regions that were used for relative quantification of Kir4.1 expression in low-magnification images of transverse sections in the spinal cord. F: qauntification of Kir4.1 expression in transverse sections of the spinal cord reveal significant differences in Kir4.1 expression in Rexed’s Laminae IV, VII, V, I/II. Mean data demonstrates significant differences between Rexed’s Laminae 1/II and all other regions of the spinal cord examined (P < 0.001, Tukey-Kramer multiple comparisons test, n = 21). Kir 4.1 expression in region 3 or Rexed’s Laminae V is also significantly different from Rexed’s Laminae 9 (n = 21, P < 0.001).